The iPOS questionnaire was applied to 103 patients in a prospective study. With the questions answered by the patients, there were identified the main concerns they had, the prevalence of the symptoms they presented at the first hospitalization, the problems related to the mood, the relationship with the family, the social integration and the relationship with the medical care team. In conclusion, the usefulness of the iPOS questionnaire was demonstrated in the early detection of the patient’s problems, both related to physical symptoms and related to the emotional state, the relationship with the family and with the medical care staff. This proves that the iPOS score is more reliable and helps the medical oncologist more in establishing the therapeutic conduct than the ECOG score.
Integrated Palliative Outcome Scale (iPOS) for the early detection of palliative care needs of cancer patients
Scala Integrată a Rezultatelor Îngrijirilor Paliative (iPOS) în detecţia timpurie a nevoii de îngrijiri paliative a pacienţilor oncologici
First published: 25 martie 2022
Editorial Group: MEDICHUB MEDIA
DOI: 10.26416/OnHe.58.1.2022.6224
Abstract
Rezumat
În cadrul unui studiu prospectiv, a fost aplicat chestionarul iPOS la 103 pacienţi. Cu ajutorul întrebărilor la care au răspuns pacienţii, s-au identificat principalele teme de îngrijorare pe care le-au avut, prevalenţa simptomelor pe care le prezentau la prima internare, problemele legate de starea emoţională, relaţia cu familia, integrarea socială şi relaţia cu echipa medicală de îngrijiri. În concluzie, s-a demonstrat utilitatea chestionarului iPOS pentru detectarea precoce a problemelor pacientului, atât legate de simptomatologia fizică, dar şi cele legate de starea emoţională, relaţia cu familia şi cu personalul medical de îngrijire. Se dovedeşte astfel că scorul iPOS este mai fiabil şi ajută mai mult oncologul în stabilirea conduitei terapeutice decât scorul ECOG.
Introduction
Integrated Palliative Outcome Scale (iPOS) is normally used as a tool for measuring the outcomes of the palliative care and it has been welcomed by patients and professionals as a more streamlined measure, which is brief, yet which can still capture their most important concerns – both in relation to symptoms, but also extending to information needs, practical concerns, anxiety or low mood, family anxieties and overall feeling of being at peace(1). Given the fact that the European Society of Medical Oncology (ESMO) recommends the integration of medical oncology with palliative care, and that the palliative care is a medical competence in Romania that can be associated with several specialties, we considered it useful to research the use of iPOS in medical oncologist practice for patients with good performance status(2).
In the medical oncology, the performance status of patients is assessed according to the ECOG scale. This scale is based on the existence of the symptoms, their intensity, the physical performance of the patients, appreciated globally by how long they have to stay in bed during the day and by the need of help for various normal activities. For guidance on tolerance to chemotherapy, ECOG is almost sufficient, but cannot particularly assess each patient’s symptoms or mental state. This inconvenience makes the oncologist unable to identify the treatment needs for the physical symptoms and the mental state as soon as possible and to intervene with the appropriate palliative treatment. In this context, the iPOS scale solves the problem. Thus, the screening of the symptoms is done from the beginning in detail and the palliative treatment is applied much faster and more adequate, in line with the recommendations of the scientific forums in this field. The early identification of palliative care needs being an absolute necessity, signaled by all medical and political forums, the early screening of palliative care needs becomes extremely useful and the iPOS scale, used as a screening tool, can bring to light many of the patients’ problems and concerns, regardless of their performance status. The results of this research show that the iPOS scale reveals to the medical care team a much more complex picture of the patient’s problems than the quick history at the beginning of a dispensary visit or treatment session. In addition, the scale can be completed in 10 minutes, with or without the involvement of the medical team, it can be reevaluated at chosen intervals, and can also provide a dynamic picture of the patient’s progress.
The present study is a prospective, cross-sectional, descriptive and analytical study based on questionnaires applied on a target population of oncological patients with an ECOG performance status of 0 or 1 which aims to demonstrate the usefulness of the iPOS scale as a tool screening for the early discovery of the real needs of palliation, a necessary step in the early integration of palliation in clinical medical oncology.
Materials and method
We included 100 voluntary patients of the Medical Oncology II ward from the “Prof. Dr. Alexandru Trestioreanu” Institute of Oncology, Bucharest. The period of inclusion was January 2020 – April 2021.
Inclusion criteria: cancer diagnosis, age over 18 years old, good performance status (ECOG 0 or 1), patients under chemotherapy or presenting for posttherapeutic checkups.
Exclusion criteria: age under 18 years old, ECOG higher than 1.
Statistical analysis. Data collected in Microsoft Excel was processed in R version 4.0.3 (2020-10-10) – Copyright (C) 2020, The R Foundation for Statistical Computing Platform, during May 2021.
Description of the group sample
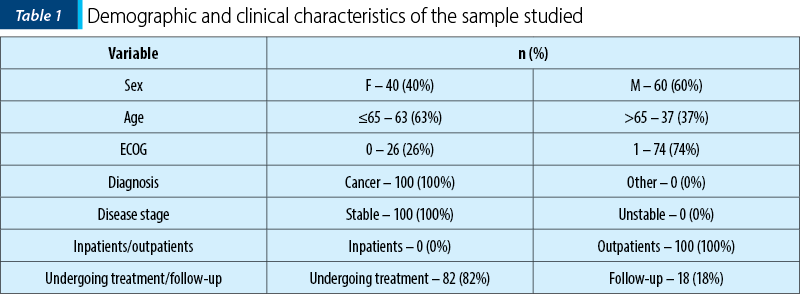
A total of 103 iPOS questionnaires were completed. Three questionnaires were completed by patients with ECOG 2, being excluded from the study, according to the inclusion-exclusion criteria in the study. The questionnaires were fully completed, with no data missing.
The demographic and clinical characteristics of the patients included in the study are presented in Table 1.
iPOS scale presentation
The iPOS questionnaire contains a set of 10 questions designed to identify how the patients subjectively describe their clinical, social and emotional status. With the exception of the first question, which invites the patient to reflect on the main concerns and problems encountered in the disease, the other nine questions can be quantified with a score from 0 to 4, depending on the chosen answer (questions 2-9) or from 0 to 2 in the case of question 10, which clarifies the help requested by the patient in completing the questionnaire.
The first question of the questionnaire, “What are your main problems or concerns at the moment?”, aims to make a summary of the fears and problems identified by the patient at the time of the questionnaire. Although unquantified, this first question allows the patient to express freely, unguided, the worst aspects of the disease adaptation process and opens the way to a sincere and deep self-assessment.
The following eight questions, quantifiable from 0 to 4, depending on the answer, cover the following aspects.
-
Physical: Q2, with multiple subitems containing the main symptoms known or those identified in addition by the patient, where 0 represents the total absence of that manifestation, while 4 means maximum severity, with the greatest impact on quality of life.
-
Affective: Q3 and Q5, which capture their own level of anxiety and mood in the last three days, and Q6, which proposes a self-assessment of their own performance as a functional individual.
-
Communication and practical aspects: Q4, which reflects the way the patient feels the anxiety of close relatives, Q7, which shows the patient’s relationship with family and friends, at the level of communication; Q8 provides clues to the patient’s need for information and Q9 assesses the patient’s involvement with the medical team in solving their problems.
The last question, Q10, identifies the need for help in understanding and completing the questionnaire, being quantified with a score from 0 to 2, 0 meaning no need for help, 1 – help received from a friend or relative, and 2 – help from the staff medical.
Results and discussion
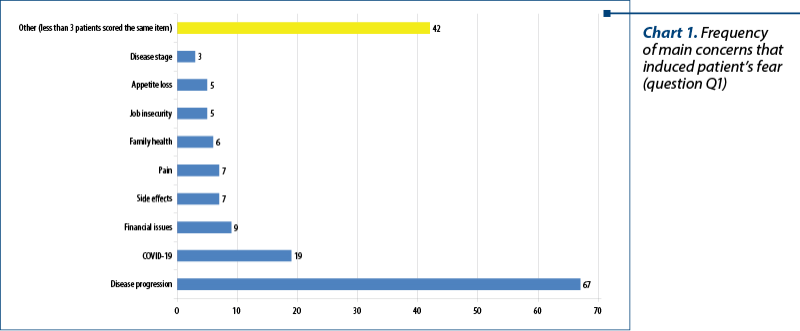
Question 1 of the iPOS questionnaire is inviting patients to reflect on the main issues and concerns they are confronting: “What are your main issues or concerns at the moment?”. Fear of SARS-CoV-2 infection, financial problems, fear of treatment side effects, fear of pain, worries about family health and job insecurity are the most important concerns in terms of frequency, after the fear of the disease progression, that easily outweighs other fears (Chart 1).
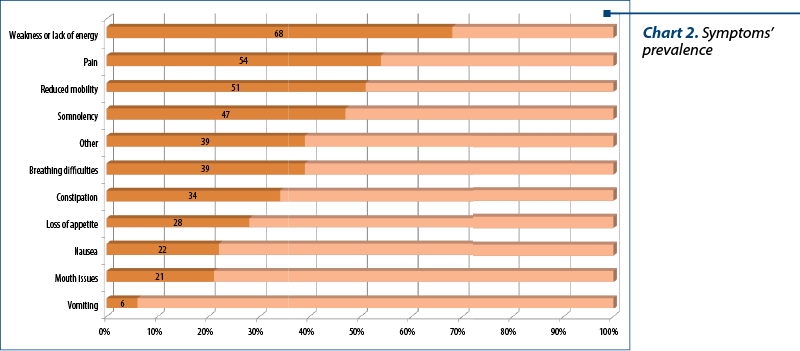
Question 2 is investigating symptoms prevalence: “Below there is a list of symptoms you may or may not have. For each symptom, tick one box that best describes how this symptom has affected you in the last three days.” The symptoms were rated from 0 to 4, depending on how they affect the daily activities or the ability to concentrate in the last three days, as follows: 0 – Not at all. I haven’t had this symptom in the last three days; 1 – Slight, little or no influence on activities or ability to concentrate; 2 – Moderate, partial influence on activities or ability to concentrate; 3 – Severe, accentuated influence on activities or ability to concentrate; 4 – Overwhelming, unable to think of anything else.
In terms of the prevalence of symptoms, lack of energy comes first, with 68% of patients stating they have experienced this symptom in the last three days (Chart 2). Pain and reduced mobility are the next symptoms in terms of prevalence, both being present in more than 50% of patients. The least common symptoms are vomiting, mouth problems and nausea.
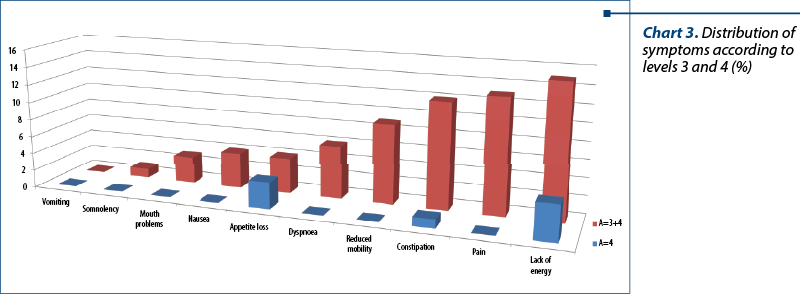
Analyzing each symptom separately, we concluded that, although the patients have been considered ECOG 0 or 1 regarding performance, meaning that they perform their daily activities almost normally, however, completing the iPOS scale, which is much more rigorous and sensitive compared to the ECOG scale, the patients were able to report symptoms and problems more accurately. Some symptoms were also marked with the most severe level of damage, which is surprising given the good general condition of the patients (Chart 3).
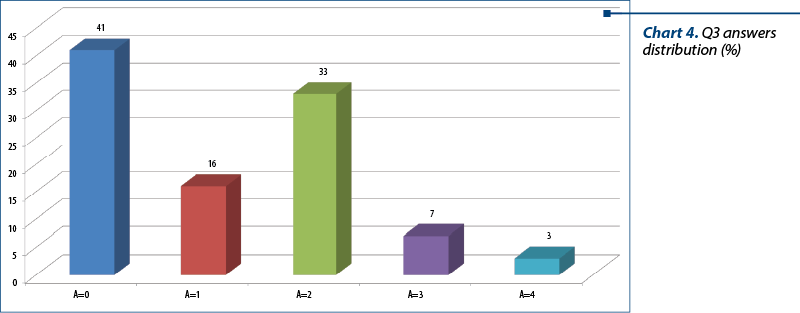
Question 3 of the questionnaire opens the psychosocial chapter of the scale and probes the patient’s degree of anxiety: “Have you been anxious or worried about your illness or treatment for the past three days?” Answers could be graded from 0 to 4, as follows: 0 – No, not at all; 1 – Occasionally; 2 – Sometimes; 3 – Most of the time; 4 – Always. It should be noted that more than half (59%) of the patients experienced anxiety or were concerned about illness or treatment in the last three days, with 10% being affected most of the time or permanently (Chart 4).
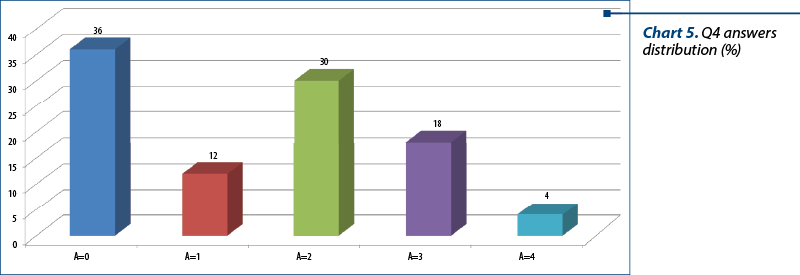
Question 4 of the questionnaire proposes the patient to score the way in which their family or friends are affected by his illness or treatment, thus testing the social implications: “In the last three days, has anyone from your family or friends has been worried or anxious about your illness or treatment?” The answers could be graded from 0 to 4, as follows: 0 – No, not at all; 1 – Occasionally; 2 – Sometimes; 3 – Most of the time; 4 – Always.
Almost two thirds (64%) of the patients felt a degree of anxiety among those close to them, 22% feeling this among those around them most of the time or permanently. Also, 42% of patients perceive the concern of family or friends only occasionally or sometimes, 36% answering that none of the close entourage is affected by the disease or its treatment (Chart 5).
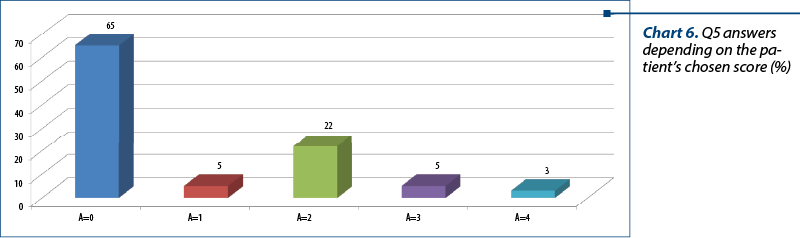
Question 5 clarifies the patients’ mental status. The patient is asked to write down from 0 to 4 the amount of the time he felt depressed: “In the last three days, have you felt depressed?” Answers could be graded from 0 to 4, as follows: 0 – No, not at all; 1 – Occasionally; 2 – Sometimes; 3 – Most of the time; 4 – Always.
The answers revealed that 35% of the patients were least occasionally experiencing a state of depression, with 8% acknowledging that it was an almost continuous or even permanent condition. If we consider how difficult it is for a patient to recognize the symptoms of depression, we can say that these results are not accidental, depression being a frequently associated comorbidity but also underdiagnosed by the cancer patient (Harvey, 2001). In fact, Szelei and Döme state in their research Cancer and depression: a concise review, published in 2020, that, “considering that depression is frequently underdiagnosed in cancer patients, screening is recommended in this population” (Szelei and Döme, 2020)(3,4).
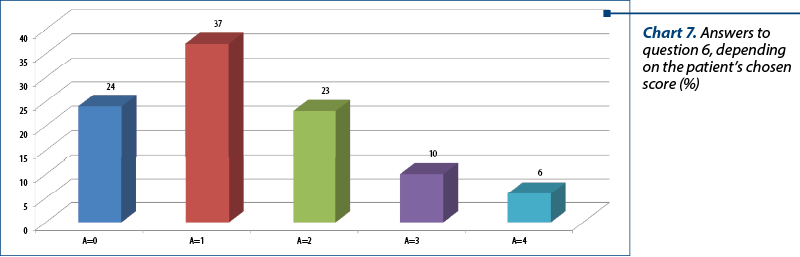
Question 6 tests by self-assessment the state of satisfaction related to oneself, completing the image surveyed in question 5: “In the last three days, have you felt satisfied as a person?” Answers could be graded from 0 to 4, as follows: 0 – Yes, all the time; 1 – Yes, most of the time; 2 – Sometimes; 3 – Occasionally; 4 – No, not at all.
Beside the high percentage of patients who are satisfied with how they function as a person (61%), a normal score for a good performance status group, we also find patients less satisfied with their own person, 10% declaring that they are only occasionally satisfied and 6% being in a permanent dissonance with themselves (Chart 7).
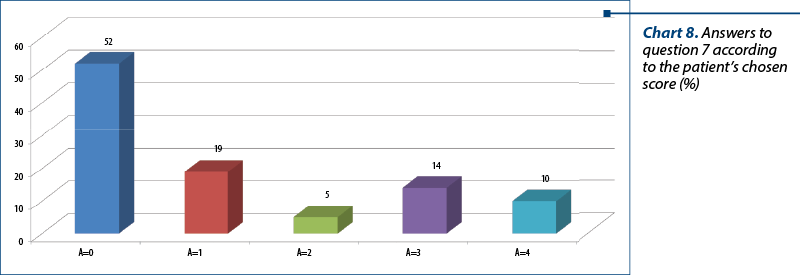
Question 7 of the test completes the social picture of interactions with family and friends, probing issues related to communication with the loved ones: “In the last three days, have you been able to communicate with your friends or family about how you are feeling?” Answers could be graded from 0 to 4, as follows: 0 – Yes, as much as I wanted; 1 – Yes, most of the time; 2 – Sometimes; 3 – Occasionally; 4 – No, not at all.
It can be noticed that almost one quarter of the patients (24%) do not communicate enough with family or friends (Chart 8).
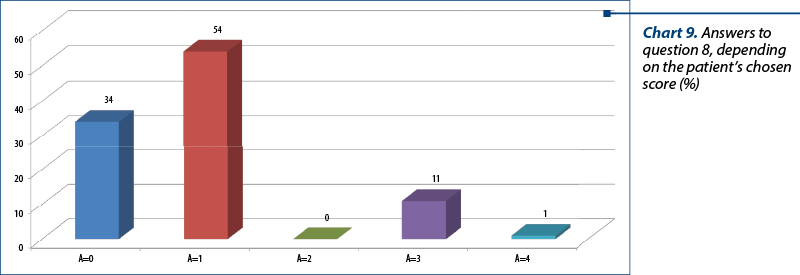
Question 8 and Question 9 describe patient’s relationship with medical care team or other authorities who are responsible for providing information and addressing issues that the patient and his or her family are going through: “In the last three days, how much information have been given to you, your family or your friends?” Answers could be graded from 0 to 4, as follows: 0 – Complete information or as much as I wanted; 1 – Information was provided for most questions; 2 – Information was provided on request, but I would have liked more; 3 – Very little offered and some issues were not addressed; 4 – Not at all, we wanted more information.
We can see that 12 out of the 100 patients interviewed were dissatisfied with the information related to the disease and treatment, of which one patient was completely dissatisfied. Analyzing these 12 patients, we concluded that only one of them completed the questionnaire alone (Q10), the rest being assisted by a member of the care team, which means a high degree of sincerity and raises the issue of discontinuities in communicating with the patient.
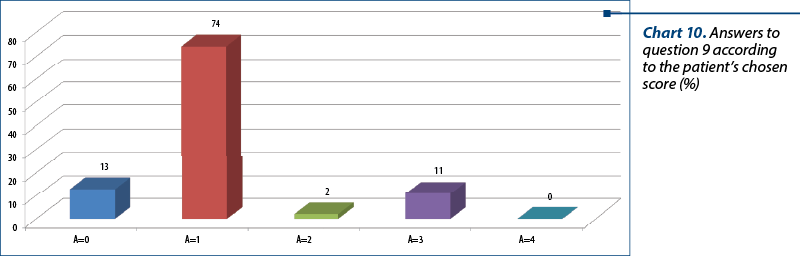
Question 9 completes the picture of the patient’s relationship with the care team, addressing the practical aspects of the relationship related to solving medical, financial or personal problems that have occurred in the last three days: “In the last three days, has the care team addressed any medical issues caused by your illness, financial or personal?” Answers could be graded from 0 to 4, as follows: 0 – I had no medical problems; 1 – Occasional issues/issues that have been addressed; 2 – Some issues/issues partially addressed; 3 – Serious issues/issues that have not been addressed; 4 – Overwhelming issues/issues that have not been addressed at all.
The same as in the case of obtaining information from the care team, regarding the practical aspects of the collaboration between the team and the patient, there are patients who are not fully satisfied, 11 patients considering that they had serious problems that were not addressed. All the 11 patients completed the questionnaire with the assistance of a member of the care team.
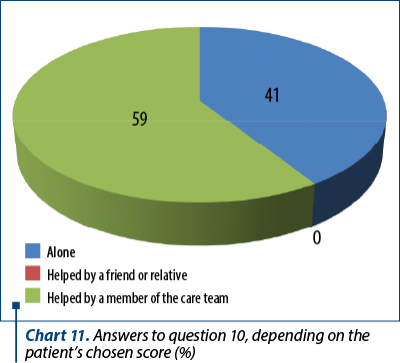
The last question, Q10, although much more useful in patients with end-stage disease or poorer performance status, provides useful information about the patients’ ability to complete this questionnaire on their own: “How did you complete the questionnaire?” Answers could be graded from 0 to 2, as follows: 0 – Alone; 1 – Helped by a friend or relative; 2 – Helped by a member of the care team.
The answers revealed that 41% of patients completed this questionnaire on their own, with the remaining 59% being assisted by a member of the care team. Those in the second category were assisted by a member of the care team either because they requested it, or because the patient was physically unable to complete this questionnaire (the patient had vision problems or the patient was connected to the infuser).
Conclusions
While ECOG scale, usually used in current practice in Romanian oncology, especially to guide the therapeutic decision, fails to describe the total needs of the patient, iPOS scale has the potential to bring to light problems, needs and concerns that may be less analyzed during outpatient visits. The answers revealed that 43% of the patients had a state of anxiety at least occasionally, and 30% had at least occasionally gone through a state of depression. Also, 39% of patients were not satisfied with themselves for the most part. All these data show a psychoemotional load that is not at all surprising, if we take into account the diagnosis of these patients, but relevant in the context of the need for screening of these needs, which can sometimes go unnoticed at a normal visit.
The differences in the assessment of the need for palliation are obvious between the ECOG and iPOS scales. Thus, at an ECOG score of 0 or 1, 71% of patients had at least one grade 2 of severity symptom, 39% had at least one grade 3 of impairment symptom, and 7% were overwhelmingly affected by at least one symptom. This confirms the value of iPOS in screening for the need for palliative care for cancer patients.
The iPOS questionnaire also helps to detect early anxiety and depression that are common in cancer and which the ECOG questionnaire cannot detect.
Only 32% of patients think that family and friends are worried most of the time or always about their illness, and 34% communicate only occasionally or not at all with them, thus one-third of the patients interviewed do not find support inside the personal entourage, which is an alarm signal for the care team regarding the relationship with the family.
As for the relationship with the care team, the iPOS scale reported deficiencies in communication between the care team and the patient.
Comparisons with other studies could not be made because iPOS was introduced in studies only from the perspective of its use in palliative care. A screening for symptoms to assess the need for palliation was initiated in the IZERZO study, which was not published(5).
Using the iPOS scale as a screening tool in the public and private oncology system would lead to a much earlier detection of serious problems less reported by the patient or identified by the care team during dispensing or treatment visits. iPOS is constantly evolving and is also undergoing revisions in order to optimize it(6).
Conflict of interests: The authors declare no conflict of interests.
Bibliografie
-
https://pos-pal.org/maix/ipos_in_english.php
-
https://www.esmoopen.com/article/S2059-7029(20)32279-1/fulltext
-
Chochinov HM. Depression in cancer patients. Lancet Oncol. 2001 Aug;2(8):499-505.
-
Szelei A, Döme P. Cancer and depression: a concise review. Orv Hetil. 2020 May; 161(22):908-916.
-
https://clinicaltrials.gov/ct2/show/NCT03237884
-
https://www.ahspartnership.org.uk/admin/js/libs/tiny_mce/plugins/moxiemanager/data/files/Dissertation,%20Catriona%20Grant.pdf
Articole din ediţiile anterioare
Câteva instrumente necesare în practica îngrijirilor paliative din oncologia medicală
Îngrijirile paliative sunt o parte integrantă din cadrul îngrijirilor pacienţilor oncologici. De multe ori se face o confuzie între îngriji...
Breviar terapeutic al cancerului pulmonar fără celule mici, din perspectiva oncologiei medicale
Acest ghid sumarizează recomandările Societăţii Americane de Oncologie Clinică şi prezintă într-o manieră schematică principalele modalităţi de abo...