Acasa
> Reviste de specialitate
> ORL.ro
> Studiu comparativ privind efectele corsetării asupra unor parametri descriptori ai sprijinului plantar static și dinamic la pacienți cu scolioze și fără patologie podală primară
INTERDISCIPLINARE
Studiu comparativ privind efectele corsetării asupra unor parametri descriptori ai sprijinului plantar static și dinamic la pacienți cu scolioze și fără patologie podală primară
Compared study regarding the effects of the corset in patients with scoliosis and without a primary podal pathology on some descriptive parameters of the static and dynamic plantar fasciitis support
Clinical study developed in CNCNRNC “Dr. N. Robănescu”, where many scoliotic patients are treated and evaluated with ultramodern last-generation equipment, including equipment for evaluation of the podal support (unique in Romania when the study began). Scoliotic patients received gymnastic and trunk-orthotics repostural treatment (Cheneau corset) and were evaluated with and without the corset in three sessions. The results are presented in this paper.
Keywords
scoliosis, podal support, Cheneau corset
Rezumat
Studiul a fost inițiat în CNCRNC „Dr. N. Robănescu”, unde sunt tratați foarte mulți pacienți cu scolioze și care pot fi evaluați cu aparatură ultramodernă, de ultimă generație, printre care și pe aparatul de evaluare a sprijinului plantar, unic, la debutul studiului, în spitalele din țară. Pacienții cu scolioze au fost tratați cu gimnastică și reposturare în orteze de trunchi - corset Cheneau - și evaluați pe parcursul a trei internări, cu și fără corset. Rezultatele sunt prezentate în lucrarea de față.
The study took place in the “Nicolae Robănescu” Rehabilitation National Centre for Children where there are a lot of children with scoliosis under supervision and following a treatment, being initiated 4 years ago, when we started the evaluation of the patients with scoliosis with the new apparatus of evaluation of the plantar support, this device being unique in the country. The evaluation was registered during several hospitalization periods of the patients with and without trunk orthosis (Cheneau corset).
Through this we want to objectify the podal support highlighted in specific investigations, to study if there is a relation between the vertebral curvatures and the modification (a deviation from the normal) of the foot contact with the floor.
We also investigate if these posture vices are symptoms of the scoliosis, they occur at the beginning of these disorders, they undergo modifications through the evaluation of the disease and how can we bring our intervention beneficially and conservatively on these, specifically if wearing an appropriate corset and doing Klapp and Cotrel specific physical exercises (gymnastics) significantly improves or not the characteristics of the static and dynamic plantar support.
The theme is unique in the country, there is no other study referring to this subject in our literature and in the world, we can find articles related to the podal support only in the rheumatic disorders(1).
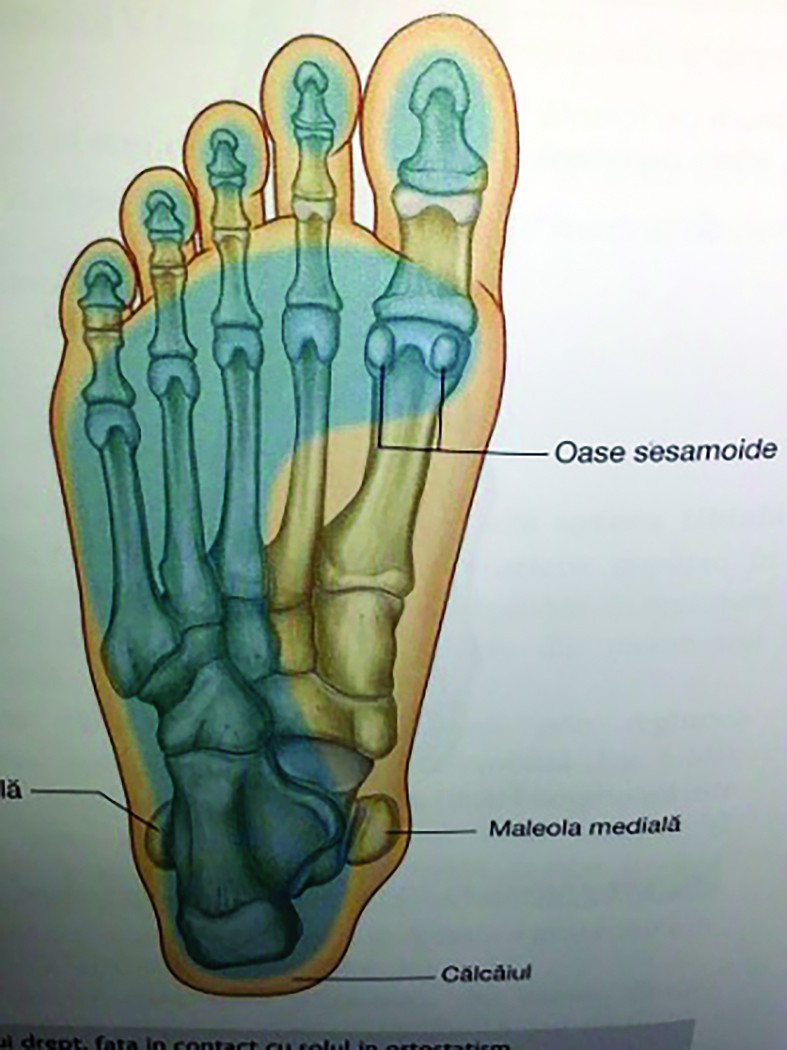
The plantar support is defined as the foot contact with the surface of support, the leg being in resting position or walking, and it was highlighted in our study by the foot scan 7 gait 2nd generation. Normally, the body weight is distributed left-right 50% - 50% and the proportion heel - the forepart of the foot (the metatarsal and toes) 25% - 25%.
The parts of physiological support are the heel, the lateral part, and the forepart of the foot, with the “hollow” in the medial zone, the apparatus “colouring” these parts with yellow or green.
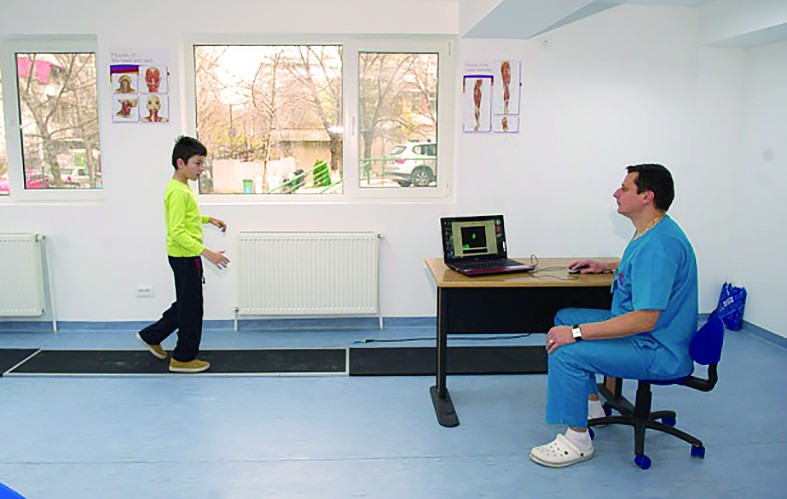
We used modern evaluation and training equipment such as:
Foot scan 7 gait 2nd generation, 2 m plate, 16 sensors - as far as we know, this device is the only one existing at the moment of study initiation in a rehabilitation centre for children in the whole country;
Terra band training apparatus - a device on the wall and on the floor.
The Foot scan measures the pressure with which the plant presses the sensors board (it contains 16.000 sensors, spread on a 2-meters distance (for example, 100 Ns/ cm² is higher than 100 Ns/4 cm²). The platform registers the local pressure during the full contact of the foot, with a high frequency, the information being given by a lot of small sensors, with a density of almost 3 sensors on square centimetre. Every sensor of the foot scan system renders the quantity of force applied for every measured frame.
Foot scan represents a dynamic system of measuring plantar pressure with a high frequency of almost 300 sequences/second. The measurements are made in static and dynamic situations, several tests, the methodology applied in this study are 3 statics and 3 dynamics.
The highest value measured is coloured in red, then the values decrease reaching the lowest value coloured in blue.
The pressure isn’t the same thing as the force.
The pressure represents the force (N) divided by the surface (Cm²) - Pressure - N/Cm².
Foot scan system consists of a sensors matrix that measures the force. The sensors are spread in 64 rows and columns that measure synchronically. The fact that it is known the surface of every sensor makes possible the calculation (not the measurement) of the pressure.
The application of a certain force on a surface with many sensors makes the pressure calculation possible.
When the pressure is measured, it is not important to know only if a high force is applied, but also if the contact surface is relevant.
If we apply a certain weight on a small surface, the pressure will be higher than if we apply the same quantity of force on a bigger surface.
A person with a certain type of foot (with “hollow”) has a smaller contact with the surface than a person with a flat foot. So, if the both people would have the same weight, the person with the “hollow” foot will have a higher pressure.
The scanning system of the foot measures only when the foot applies a force on the platform that is when the foot has physical contact with it.
The frequency: Hz - frame/second - when a cycle lasts for one second, we measure 500 frames and all these frames together represent a whole cycle.
The higher the frequency, the more detailed will be the information about pressure and about moving.
The USB foot scanning system measures at least 150 and at most 300 frames/seconds. The second-generation system can reach until 500 frames/seconds.
When a patient runs on a platform, the contact time is shorter than the walking time. In this case, we need a frequency.
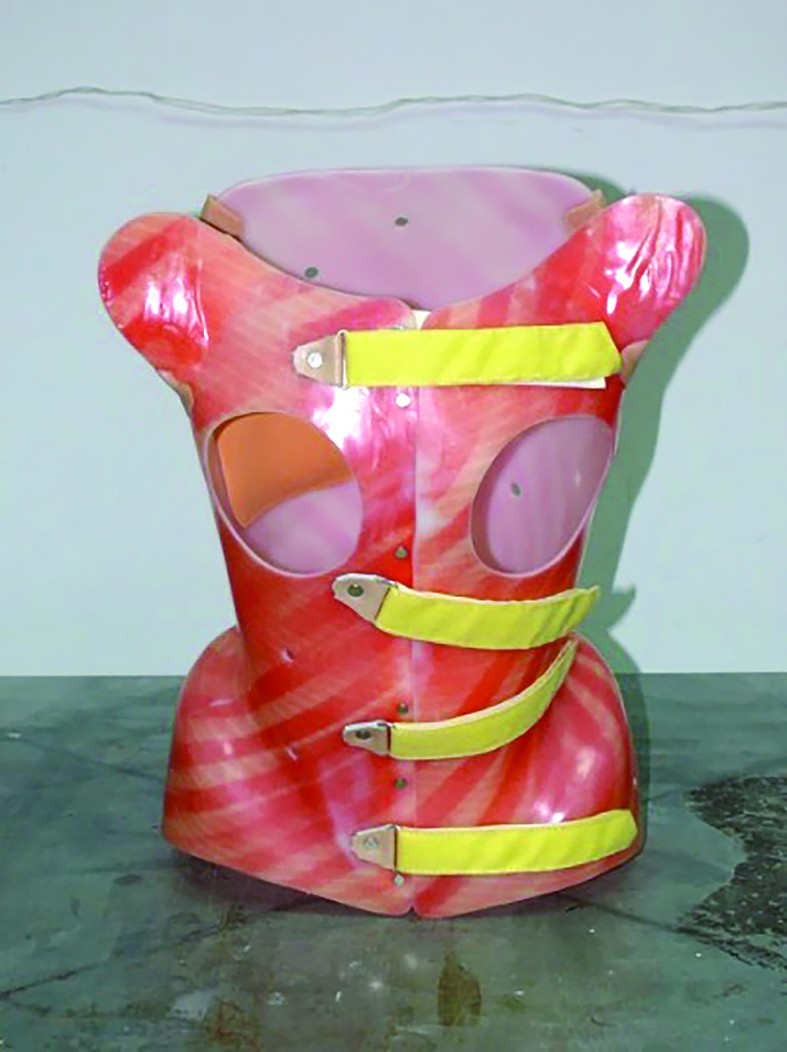
The patients are studied in two situations: without corset (in static and dynamic) and with Cheneau corset (Figure 3) in the same situations, this type of orthosis being recommended by the specialist.
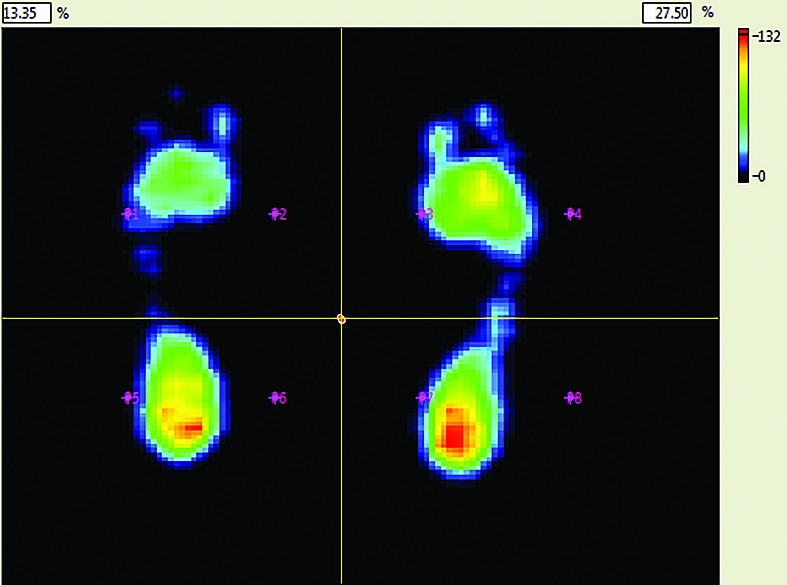
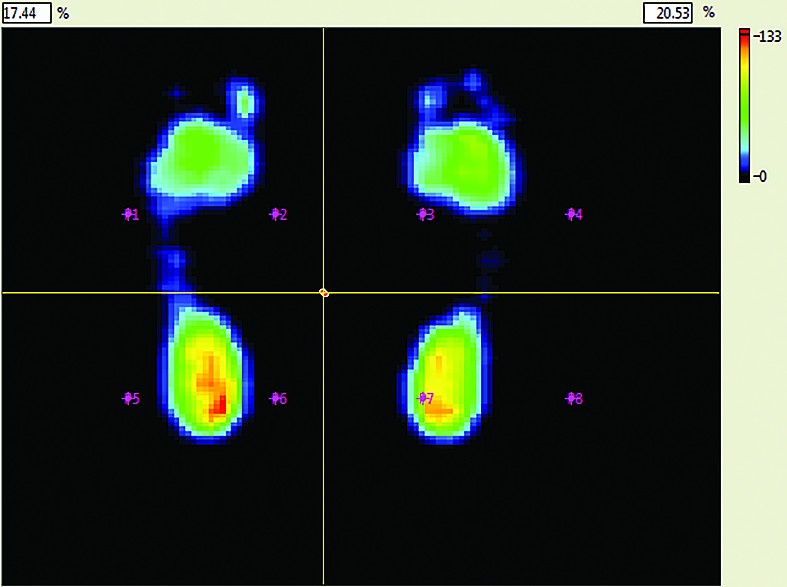
The first example: patient with right dorso-lumbar scoliosis (Cob 65 degrees) is evaluated in static position without corset (Figure 4) - the plantar support is represented on the left side where we can notice a distribution of 56-70% on the right foot, with the area with very high pressure on the right heel, on the left forepart of the foot there is a very low pressure. In Figure 5 podal support evaluation with corset is presented - the weight is distributed equally and the pressure zones are obviously diminished.
A complete cycle of steps is divided in: the static phase (60%) and the balance phase (40%). From here we get the result that the foot scanning system measures only during the static phase that lasts 600-800 msec.
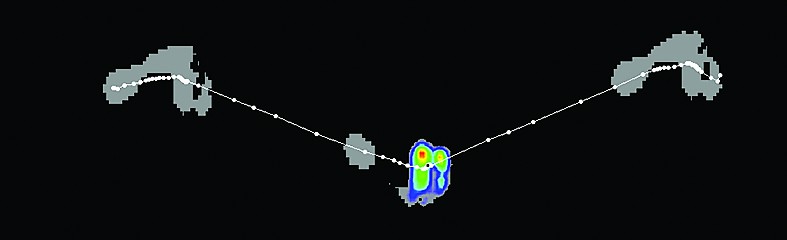
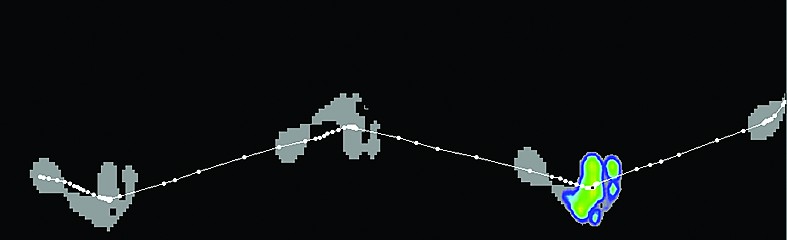
The 2nd example in dynamic: At the same patient, walking, we notice the high pressure on the forepart of the foot coloured in red (Figure 6) and lower, with a Cheneau corset, the pressure is uniformly distributed, without maximum pressure in the picture from Figure 7.
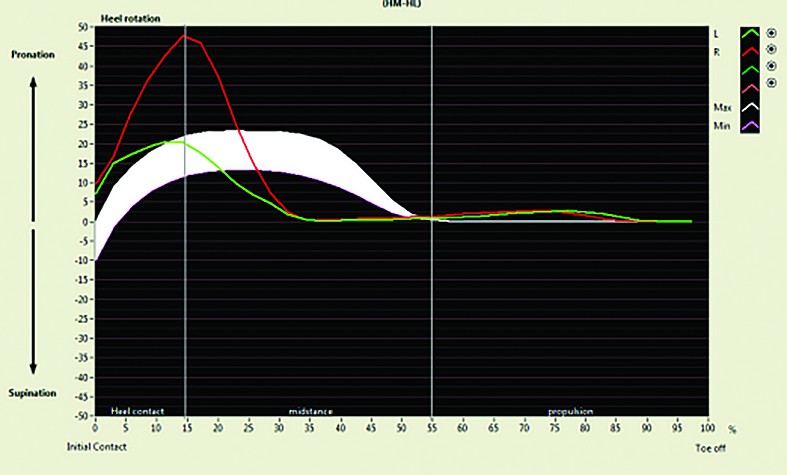
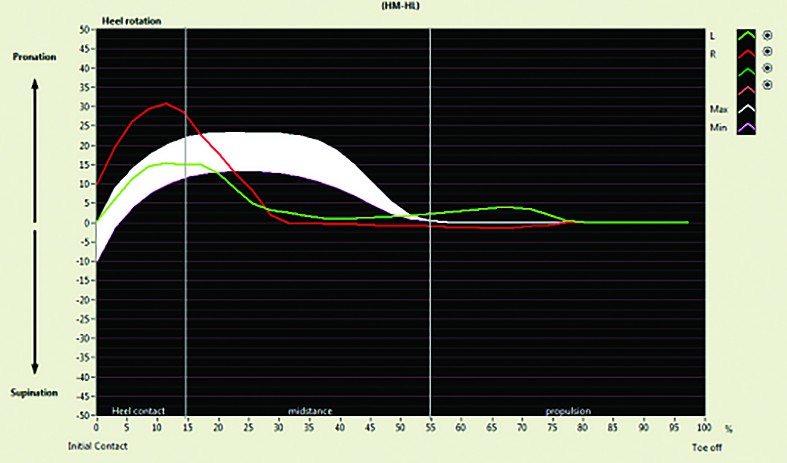
We will also follow the manifestations of the different parts of the leg during the walking steps: the rotation of the heel-pronation/supination, the balance pronation/supination of the foot. These can be followed graphically, with values on the horizontal line represented by the contact points of the foot with the surface and on vertical we can see the pronation and supination pressure measured in ns/surface. In Figure 8 we can notice a significant deviation of the heel pressure left - green and right - red from the normal graphic representation of white surface. In Figure 9, with corset, the values of the pressure reported at normal are significantly improved.
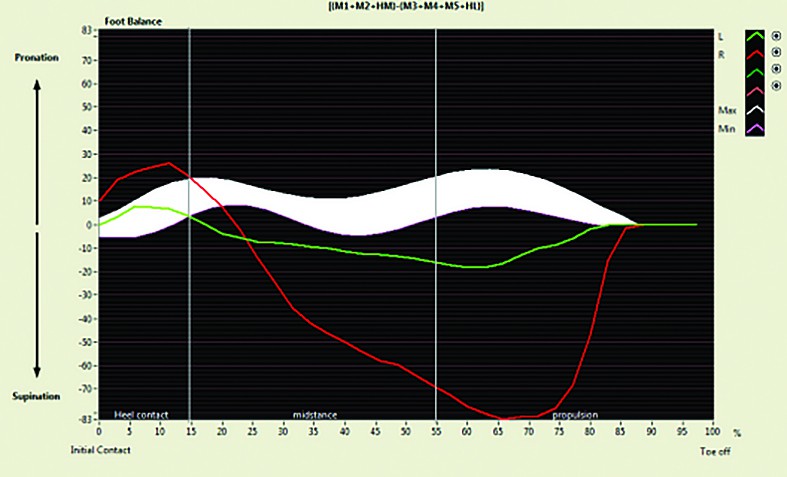
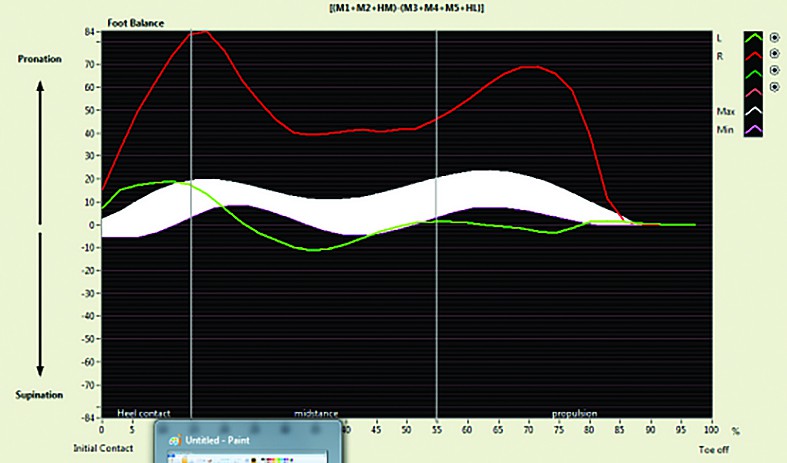
Cheneau corset position influences foot balance: in Figure 10, the graphics are situated at the superior limit and, after the change of the corset position, they are drawn at the inferior limit, being obvious that the foot manifests differently (Figure 11).
It was established that the corset’s use has spectacular effects, revealed by specific imagery and the pressure measurements with which the different parts of leg (graphically, the red zones are diminished on the surface corresponding to the maximum pressing values).
The group studied until now consists of 120 patients with scoliosis, aged between 5 and 18 years, who were evaluated first at the beginning of 2013 and then, every time they were hospitalized in the centre.
There were used tests of descriptive statistics regarding age, sex, duration of diagnostic of the disease and measures indicators: pressure, surface, the degree of the scoliosis, the percentage of distribution of the pressure on the plate - reported to normal.
We will verify if the reduction qualitatively observed - as a clinical observation - has a statistical meaning from the frequency point of view to the cases studied.
Figure 1. Colour scheme of physiological plantar support
Figure 2. Foot scan equipment
Figure 3. Cheneau corset
Results
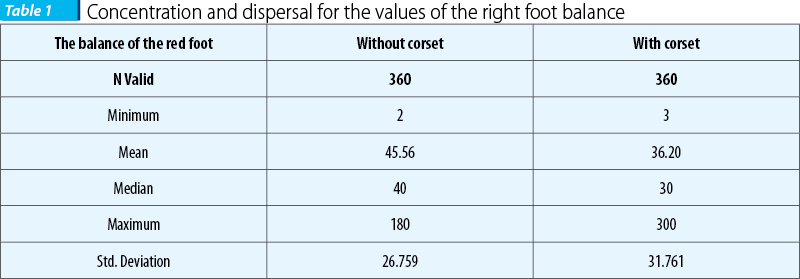
The main statistical indicators of concentration and dispersal for the values of the right foot balance, without corset and with corset (regardless the number of the hospitalization) are presented in Table 1.
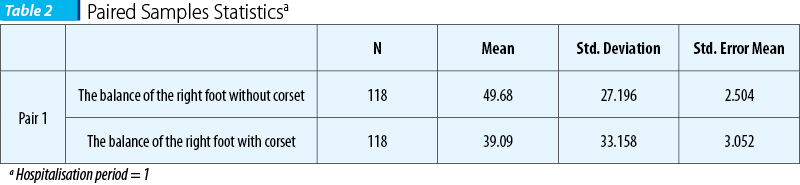
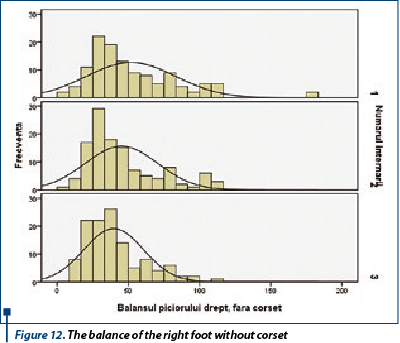
For both situations there are high discrepancies between the mean and the median values and also very high values of the standard deviations (as compared to the respective mean values). This fact suggests the existence of a pronounced asymmetry of the data and the existence of some outlier values, especially that the maximum values are more far from the mean/medial scores than the minimum values. The next two groups of histograms present the distributions of the values of the right foot balance, with corset, without corset, every hospitalization period (Figure 12, Table 2).
In Table 2 we can see that the mean (medium) of the (right) foot balance values (in the case where the patient wears the corset) is 39.09 Ns/cm², lower with 10.59 Ns/cm² than the mean value corresponding to the lack of the corset that is 49.68 Ns/cm².
The T pair test shows that this difference between the mean values of 10.59 Ns/cm² is statistically significant (the p value = 0.002).
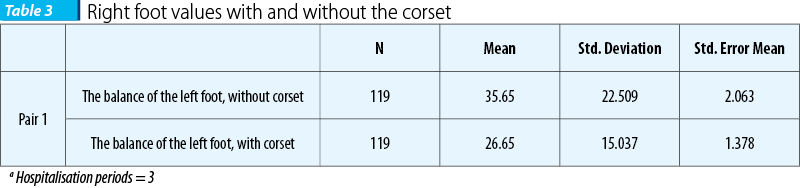
If we analyse the behaviour of every patient, we find that, nevertheless, for 34 patients (representing 28.8% from 118 selected and 28,3% from the a total of 120) the values of the right foot in the case where the patient wears the corset were higher than those obtained without corset (Table 3).
We can see that the medium values of the left foot balance (with corset) is 26.65 Ns/cm², with 9 Ns/cm² lower than the medium corresponding to the situation without corset that is 35.65 Ns/cm².
The t-pair test shows that this difference between the two medium values (9 Ns/cm²), having a confidence interval of 95% and being situated between 5.5 Ns/cm² and 12.5 Ns/cm² - is statistically highly significant (value p<0.001).
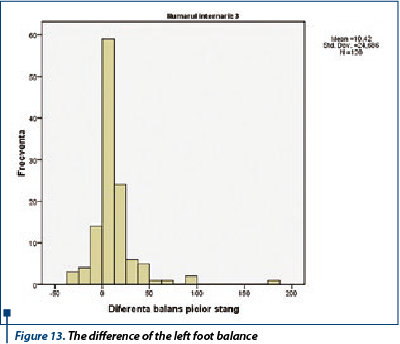
If we analyse the behaviour of every patient, instead we find that, however, for 43 patients (representing 36,1% from the 117 selected and 35,8% from 120) the values of the left foot balance in the case when the patient wore the corset were higher than the results obtained without the corset. The distribution of these differences’ values is represented in Figure 13.
Figure 4. Podal support evaluation without corset
Figure 5. Podal support evaluation with corset
Figure 6. Walking podal support evaluation without corset
Figure 7. Walking podal support evaluation with Cheneau corset
Figure 8. Graphic representation of podal support without corset
Figure 9. Graphic representation of podal support with Cheneau corset
Figures 10 and 11. Foot balance depending on Cheneau corset position
Figures 10 and 11. Foot balance depending on Cheneau corset position
Preliminary conclusions
Referring to children with scoliosis, the body weight is unequally distributed on the limbs, with focus on the limb from the primary curve part. There is a relation between the severity of the scoliotic deposture and the pressure at the plantar support exerted on the primary curve part.
The passive change of position influences the balance of the feet during walking.
According to the imagistic aspects with the afferent professional assessments - as they were previously presented - the scoliotic curvature influences the foot contact with the surface support: when the curve decreases with minimum 10 degrees, passively, through the application of Cheneau, the plantar support corrects with the standardization of the pressures on the forepart of the foot and on the calcaneal region, increasing the contact surface with the floor - towards the bearing of normality (more obvious in dynamic).
The improvement of the support can be achieved after a constant treatment (the corrective position of the Cheneau corset, kynetotherapy - Klapp, Cotrel, Schroth techniques) during hospitalization and then at home (on medium or long term).
Table 1. Concentration and dispersal for the values of the right foot balance
Table 2 Paired Samples Statistics
Figure 13. The difference of the left foot balance
Figure 12. The balance of the right foot without corset
Table 3 Right foot values with and without the corset
Bibliografie
1. http://www.mdlinx.com/rheumatology/newsl-article.cfm/6079362/ZZ6853C19EA6454B92AA8BE3CCE98E81F4?news_id=563&newsdt=050515&utm_source=WeeklyNL&utm_medium=newsletter&utm_content=Weeks-Best-Article&utm_campaign=article-section&category=latest-weekly
2. Antonescu M. Dinu – Patologia aparatului locomotor vol. I, Editura Medicală, București, 2006.
3. Antonescu M. Dinu– Patologia aparatului locomotor vol. II, Editura Medicală, București, 2008.
4. Russel J. Dianne, Rosenbaum L. Peter, Avery M. Lisa, Lane Mary, Gross Motor Function GMFM-66 & GMFM-88 User`s Manual, Mac Keith Press, 2002.
5. Onose G., Recuperare, Medicină Fizică și Balneoclimatologie - Noţiuni de bază și actualităţi vol. I, Editura Medicală, Bucureşti, 2008.