The paper presents a retrospective statistical study on a sample of patients with hypopharyngeal cancer, admitted to the ENT clinic of the County Emergency Hospital of Craiova in the period 2008-2012. Over the few last years, this disease has been the center of attention for the oncologists, having the tendency of an increasing morbidity(1,2). This type of cancer presents a special risk due to its lymphophilic character and the potential to increase rapidly its size. Few symptoms and the presence of only the cervical adenopathy makes the patients to ask for medical help often only in the advanced stages of the disease. Considering the given advanced staging, the tumor extension and the existence of the adenopathy with rapid metastasis, the prognosis of hypopharynx cancer is poor. Due to the specific gravity of the disease, an extensive statistical study presents interest from the point of view of highlighting the risk factors, the distribution of the disease according to various factors (sex, environment of origin etc.), the applied treatments (surgical and oncology) and their importance, and the correlations between the various parameters involved.
Consideraţii şi corelaţii statistice în cancerul de hipofaringe
Statistical considerations and correlations in hypopharynx cancer
First published: 24 septembrie 2018
Editorial Group: MEDICHUB MEDIA
DOI: 10.26416/Orl.40.3.2018.1932
Abstract
Rezumat
Lucrarea prezintă un studiu statistic retrospectiv pe un lot de pacienţi cu neoplasm hipofaringian internaţi în Clinica ORL a Spitalului Judeţean de Urgenţă Craiova în perioada 2008-2012. Această maladie este în ultimii ani în centrul atenţiei oncologilor de specialitate, având tendinţa de creştere continuă a morbidităţii(1,2). Acest tip de cancer prezintă un risc deosebit, din cauza caracterului limfofil şi a potenţialului de extindere. Silenţiozitatea simptomatologiei şi prezenţa doar a adenopatiei cervicale determină bolnavii să se prezinte în stadii avansate de boală. Având în vedere stadialitatea avansată dată şi de extensia tumorală, şi de existenţa adenopatiei cu metastazare rapidă, prognosticul cancerului de hipofaringe este rezervat. Din cauza gravităţii bolii, un studiu statistic extensiv prezintă interes din punctul de vedere al evidenţierii factorilor de risc, al răspândirii maladiei în funcţie de diverşi factori (sex, mediu de provenienţă etc.), al prezentării şi reliefării tratamentelor aplicate (chirurgicale şi oncologice) şi al evidenţierii corelaţiilor între diverşi parametri implicaţi.
Introduction
Malignant tumors of the hypopharynx represent 0.6-1% of the total malignant tumors and 7-10% of the malignant tumors of the ENT area. This disease has been the center of attention for the oncologists, having the tendency of an increasing morbidity(1,2).
The main triggering factors of the hypopharyngeal cancer (risk factors) are: smoking, alcohol consumption, increasing environmental pollution, long-term untreated pathological processes (chronic pharyngitis, dyskeratosis of the pharynx mucous membrane(3,4)).
The most important risk factor is smoking. In 98% of cases, patients have been abusive smokers for 15-20 years. As for the gender distribution, even though in the past the incidence of hypopharyngeal cancer was much higher in men, now the ratio decreased to 3/1, in relation to the increasing incidence of smoking in women. This type of cancer affects in general persons of mature age, with a maximum frequency in the interval of 40-60 years old. In 85-90% of cases, the doctors establish the diagnosis in stages III-IV, and only in 10-15% of cases in stages I-II. In 45-60% of cases, the primary lesion is associated with a metastatic satellite adenopathy in the cervical lymph nodes, leading to a difficult and unpleasant treatment and to a poor prognosis. The reader could compare these percentages from the literature with the statistical results obtained by us on the sample of patients we studied.
Recent findings in molecular medicine have shown that cancer is a genetic disease and that the development of neoplastic cells occurs because of the disorder of proliferation, differentiation and cell apoptosis mechanisms(5,6).
Materials and method
In this study, we present a sample of 225 patients diagnosed with hypopharyngeal cancer, who had extensions to the surrounding organs and metastatic adenopathy, boarded and treated in the ENT clinic of the Emergency Clinical County Hospital of Craiova, during 1.01.2008 and 31.12.2012 (retrospective study).
We used the information from the database of the Emergency Clinical County Hospital of Craiova about the patients diagnosed with hypopharynx cancer which we studied. The Department of Pathological Anatomy archives preserves the tumor tissues taken from the patients. Nevertheless, the clinical observation sheets of patients, registry books and operating protocols, analysis bulletins, imaging examinations of the ENT Clinic (X-rays, CT, MRI, ultrasound images, endoscopic images), anatomopathological and oncological examinations represented the main source of information for our study.
The method of research that we used was clinical and statistical, retrospective, based on a mixed analytical and descriptive research, represented by a biostatistical and mathematical analysis of the variables in relation with the disease.
We developed a working protocol for the sample of patients, establishing a database with criteria for inclusion and exclusion.
Inclusion criteria:
-
Patients diagnosed with hypopharyngeal cancer, confirmed by histopathological examination.
-
Previously untreated patients through chemotherapy, radiotherapy or surgery.
-
Patients without major psychiatric disorders.
-
There were no conditions related to age, sex, and environmental origin.
-
Patients informed consent.
-
Possibility of periodic follow-up.
Exclusion criteria:
-
Patients with associated difficulties and problems that prevented surgical and oncology treatment.
-
Patients with local relapses or continued evolution after the primary irradiation.
Results and discussions
We obtained the following statistical results on a sample of 225 patients with hypopharyngeal cancer, admitted in a five-year period (2008-2012) in the ENT Clinic of the Clinical Emergency County Hospital of Craiova. In the first part of the study, we make a descriptive statistic of the sample of patients, representing separately the distribution of cases according to various statistics parameters (age, gender, environmental origin, county of origin, occupation, topographical diagnosis, presence or absence of adenopathy, anatomopathological diagnosis, stage, and the applied surgical treatment). We realized all the computations, tables and graphs used in the statistical description with Matlab software package. For rigorous definitions of the concepts and the notions of statistics used further, see Martinez et al., Vidakovic et al., and Hogg et al.(18-20).
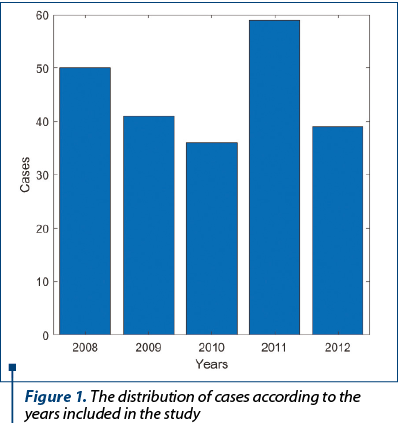
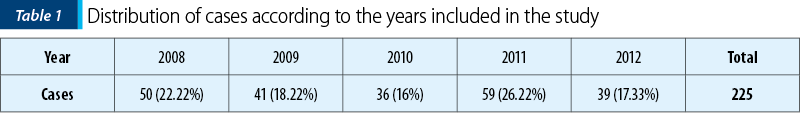
We detailed the distribution of cases according to the years included in the study in Table 1 and Figure 1.
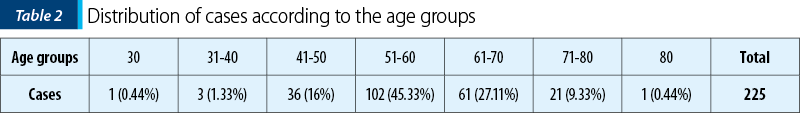
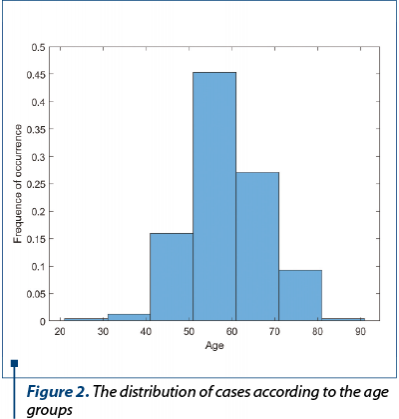
We show the distribution of cases according to the age groups in Table 2 and in Figure 2.
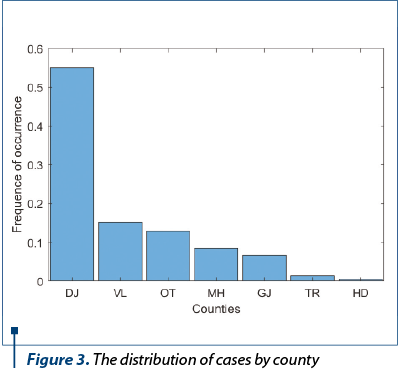
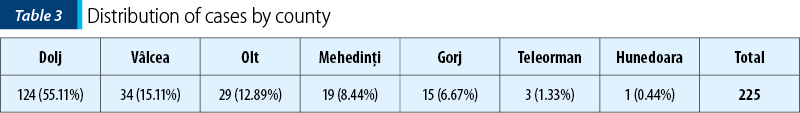
The patients included in the study sample came from the Oltenia counties (Dolj, Gorj, Olt, Vâlcea, Mehedinţi) and, in four isolated cases, from two adjacent counties (Teleorman and Hunedoara). The distribution of cases by counties appears in Table 3 and in Figure 3.
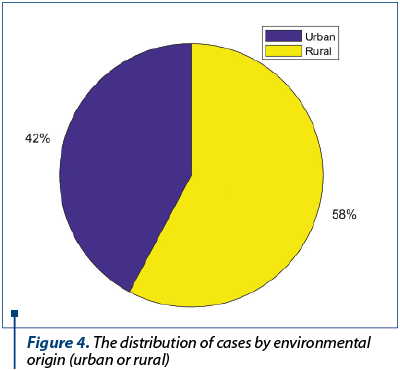
Considering the risk factors, it is interesting to study the distribution of patients related to the environmental origin, i.e. urban or rural environment. We detailed this in Table 4 and in Figure 4.

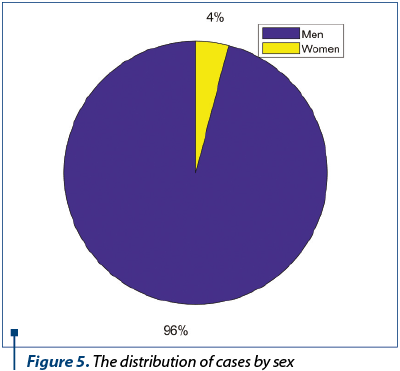
The presence of women in the studied sample was extremely low, in a proportion of only 4% of cases. We presented the distribution of patients by sex in Table 5 and in Figure 5.

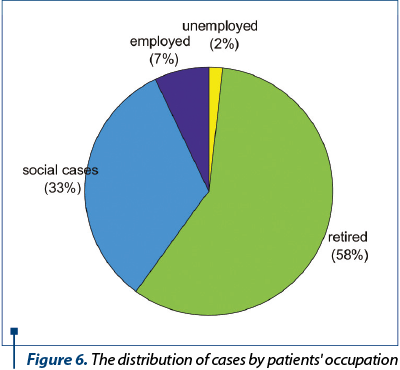
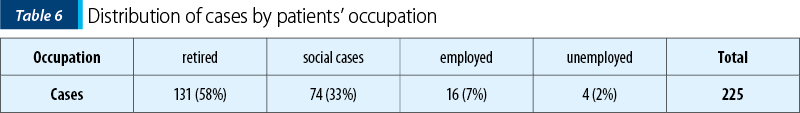
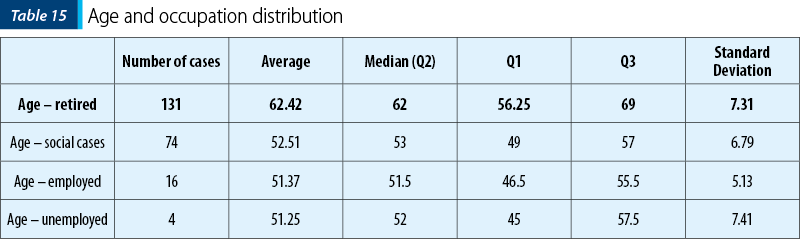
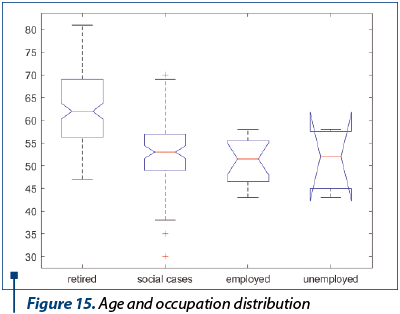
Regarding the occupation of patients, we were interested in our study only if the patients were employed, retired, unemployed, or without occupation (social cases). These categories reflect the patients’ lifestyle correlated with risk factors. We detailed the distribution of cases by the patients’ occupation in Table 6 and in Figure 6.
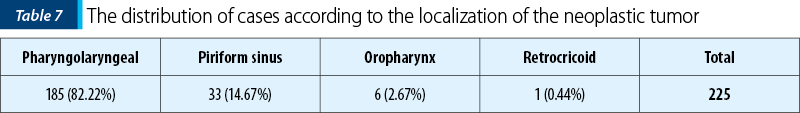
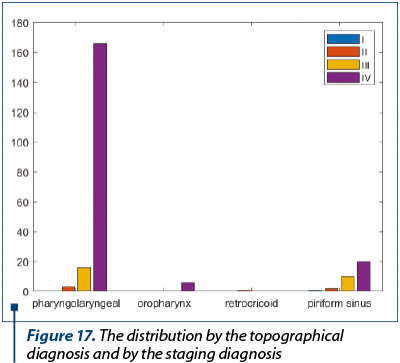
Considering the topographical situation of the hypopharynx, in the immediate vicinity of the larynx, analyzing the statistics over the five years, we found that the hypopharyngeal tumor evolved concomitantly with the laryngeal localization. We show in Table 7 and in Figure 7 the distribution of cases according to the localization of the neoplastic tumor. The pharyngolaryngeal localization prevailed in 82% of cases.

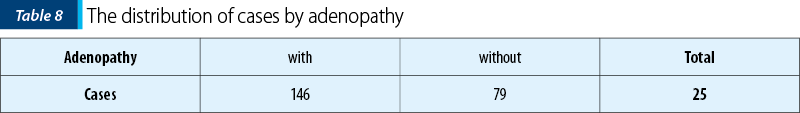
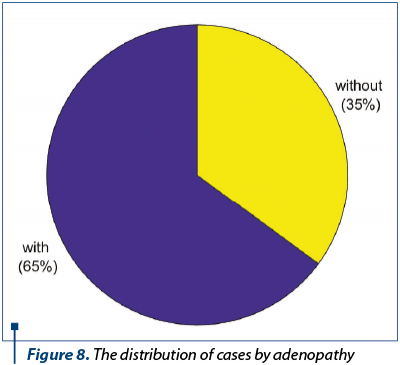
In the great invasion, hypopharyngeal cancer causes adenopathy with an aggressive evolution, with ganglia immobility. We show the distribution of cases by adenopathy in Table 8 and in Figure 8.
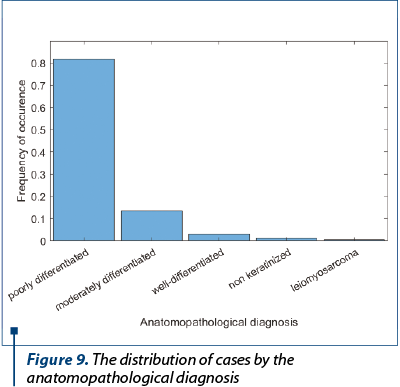
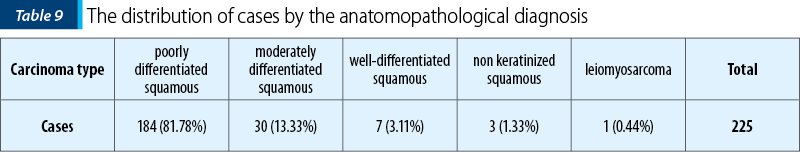
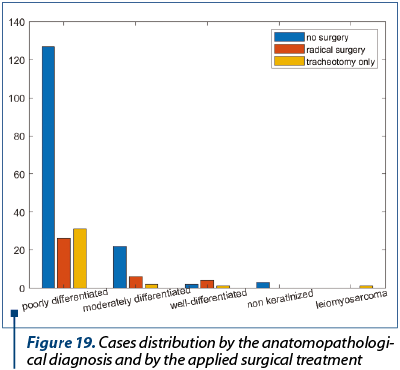
At the hypopharynx level, from the histological point of view, cancers are in the form of epidermoid carcinomas with different forms of differentiation. The undifferentiated epidermoid carcinoma was the most common in the patients’ sample that we studied. We detailed the distribution of cases by the anatomopathological diagnosis in Table 9 and in Figure 9.
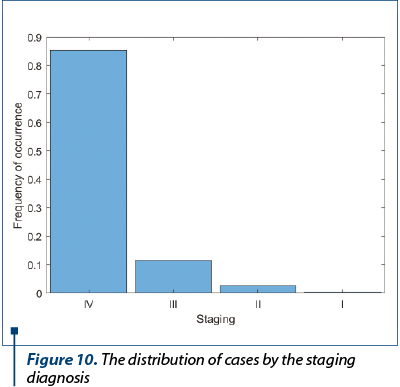
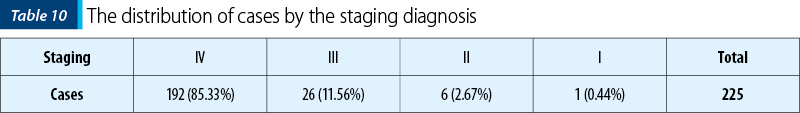
Few symptoms and the presence of only the cervical adenopathy make the patients to ask for medical help often only in the advanced stages of the disease. Due to this fact, the staging was advanced, most of the cases being in stages III and IV. In Table 10 and in Figure 10 we detailed the distribution of cases by the staging diagnosis. The percentages are similar to those found in the specialty literature.
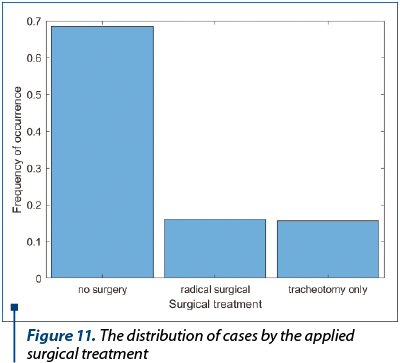
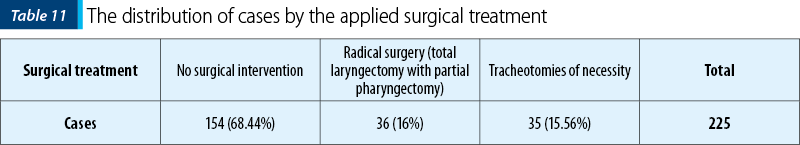
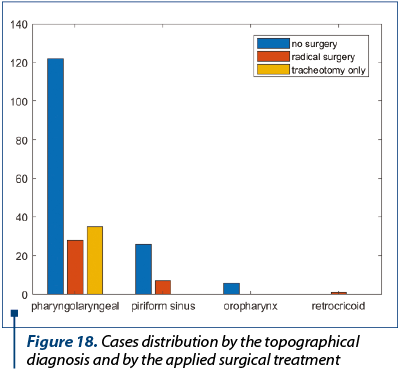
For the statistical description of the surgical treatments applied on the patients from our sample, we delimited and decided to represent three categories: patients who had no surgical intervention, patients with acute respiratory failure on which were performed only tracheotomies of necessity and the patients who received radical surgical treatment. We show the distribution of these categories in Table 11 and in Figure 11. The radical surgical treatment consisted in total laryngectomy with partial pharyngectomy.
In the second part of the study, we analyze the existence of correlations between the statistical variables presented separately in the first part. We distinguish between two types of variables: numerical ones, as is the age (in fact, the only statistical numerical variable in the study), and the categorical ones (gender, occupation, environmental origin, topographical diagnosis etc.).
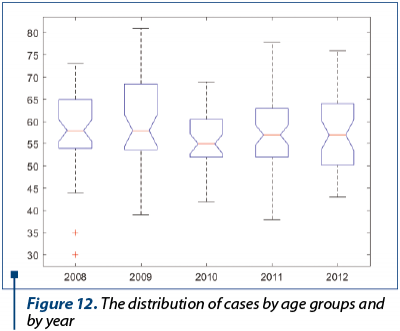
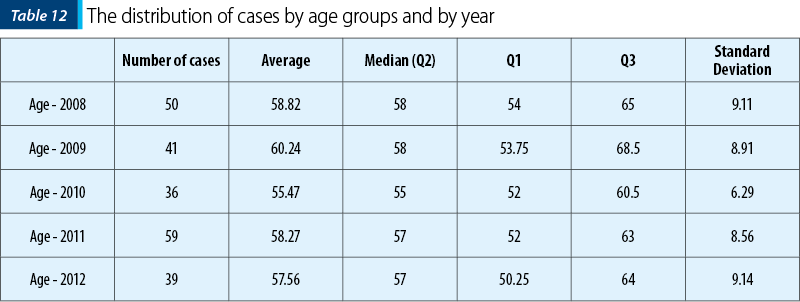
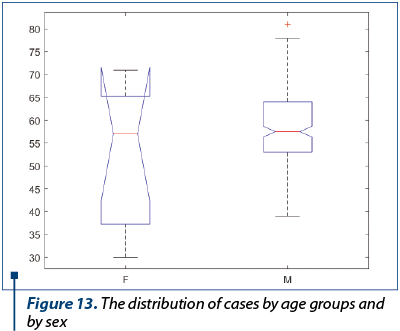
In the case of age, we analyze the distribution correlated with a categorical variable (e.g., the distribution of age by counties) and calculate the average, the median, the quartiles Q1 and Q3 and the standard deviation (see Hogg et al.(20) for the definitions of these concepts). In addition to calculating these values, we represent the distributions of age according to other parameters by boxplot graphs (see Martinez et al.(18)). In this situation, the age coupled with a definite variable, we used the Student test (see Martinez et al.(18) and Hogg et al.(20)) for the analysis of the statistical independence between the two variables. In the case of age distribution over the years included in the study (Table 12 and Figure 12) and in the case of age distribution according to the patients’ sex (Table 13 and Figure 13) the Student test reveals no correlation age – years or age – sex.

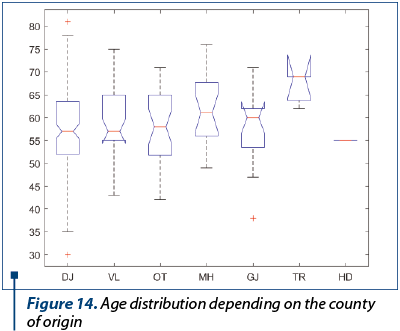
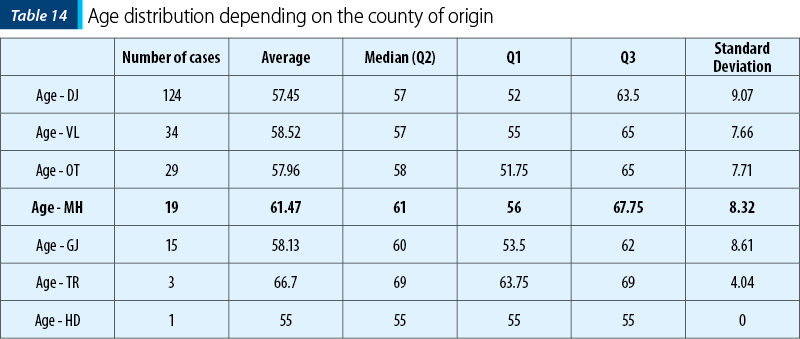
In the case of age distribution depending on the county of origin (Table 14 and Figure 14), we discovered an interesting correlation. The Student test rejects the H0 statistics hypothesis that the counties Dolj and Mehedinţi have the same average of the age distribution, with p value = 0.0494. Within the same Student test limits, the other counties (Vâlcea, Olt, Gorj) have statistically the same average of the age distribution as Dolj county. With three cases, respectively one case, the Teleorman and Hunedoara counties are statistically irelevant.
Another correlation that we discovered is age – occupation (Table 15 and Figure 15). This dependence of the average age on the patients’ occupation was expected a priori, knowing that the retired persons have a certain age threshold, and it was useful for checking the methods and software used for statistical calculations. In this situation, the Student test rejects the H0 hypothesis that the retired and the social cases have the same average of the age distribution, with p value = 6.8x10⁻²⁰. The same Student test accepts the H0 hypothesis that the employees and the social cases have the same average of the age distribution. With four cases, the unemployed category is statistically irrelevant.
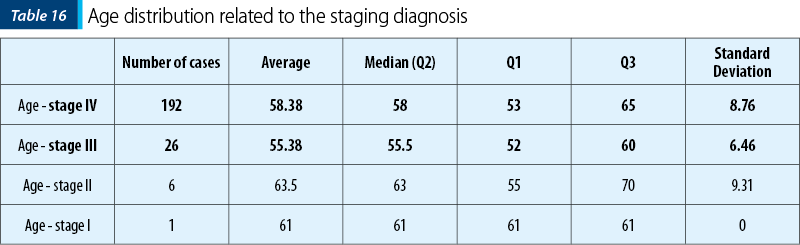
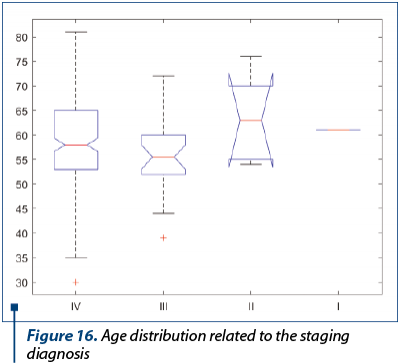
Also, for the age distribution related to the staging diagnosis (Table 16 and Figure 16), the Student reveals a statistical correlation. The H0 hypothesis that the age distributions for stage IV and stage III have the same average is rejected, with p value = 0.0262.
In investigating the correlations between the categorical variables, the main statistical instrument is the cross table, and the statistical test that decides whether two variables are independent or not is Pearson c2 test (or chi2) (Martinez et al.(18) and Hogg et al.(20)). Further, we present pairs of categorical variables for which the Pearson test rejects the H0 statistical hypothesis that the variables are independent.
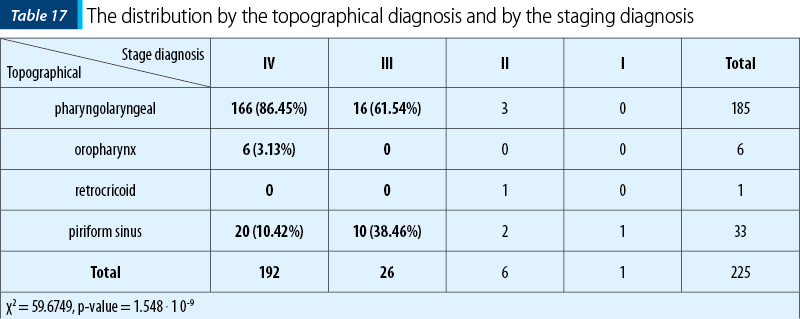
We show the correlation between the topographical diagnosis and the staging diagnosis in the cross Table 17. The H0 hypothesis (the statistical independence of the two variables) is rejected with p value = 1.548x10⁻⁹. Figure 17 shows the histogram of the cases distribution by the topographical diagnosis and by the staging diagnosis.
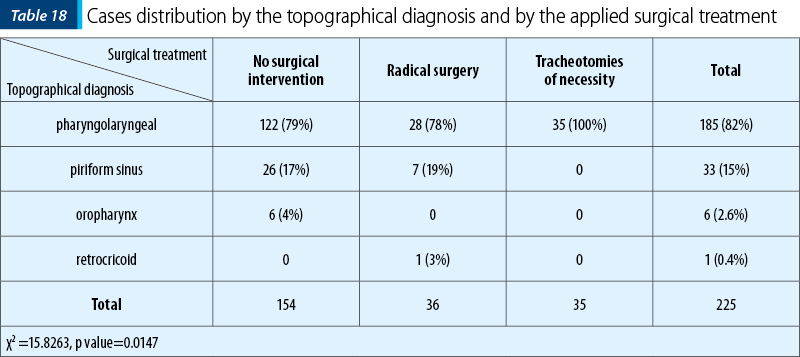
We show in the cross Table 18 and in Figure 18 the cases distribution by the topographical diagnosis and by the surgical treatment. The H0 hypothesis related to the statistical independence is rejected by the Pearson test (chi2) with p value = 0.0147.
In the cross Table 19 we show the distribution by the anatomopathological diagnosis and by the applied surgical treatment. The H0 hypothesis about statistical independence of the variables is rejected by the Pearson chi2 test with p value = 0.0185.

Conclusions
Together with laryngeal cancer, hypopharyngeal cancer represents one of the most common neoplastic pathologies in the ENT sphere.
In this paper, we performed a clinical and statistical study of the hypopharyngeal cancer, on a sample of 225 patients admitted to the ENT clinic of the Clinical Emergency County Hospital of Craiova in a five-year period (2008-2012). In the first part of the study, we synthesized through a descriptive statistics a series of statistical parameters (age, gender, environmental origin, county of origin, occupation, topographical diagnosis, presence or absence of adenopathy, anatomopathological diagnosis, stage, and the applied surgical treatment).
In the second part of the study we analyzed the existence of correlations between the statistical variables presented separately in the first part. We distinguished between numerical variables (age) and categorical variables (gender, occupation, environmental origin, topographical diagnosis etc.). The Student and Pearson chi2 statistical tests were used to elucidate the statistical independence of the analyzed variables.
Conflict of interests: The authors declare no conflict of interests.
Bibliografie
- Forastiere A, Koch W, Trotti A et al. Head and neck cancer. N. Engl. J. Med. Dec. 27 2001; 345(26): 1890-900.
- Mucci L, Adami H. Oral and Pharyngeal Cancer. In: Adami H, Hunter D, Trichopoulos D, eds. Textbook of Cancer Epidemiology. New York; Oxford University Press. 2002; 115-32.
- Head and Neck Cancer. In: Schottenfeld D, Fraumeni J, eds. Cancer Epidemiology and Prevention. 3rd ed. Oxford University Press, USA 2006.
- Davies L, Welch HG. Epidemiology of head and neck cancer in the United States. Otolaryngology Head Neck Surgery. Sep. 2006; 135(3):451-7.
- Gallo O, Chiarelli I, Boddi V et al. Cumulative prognostic value of p53 mutation and Bcl-2 protein expression in head-and-neck cancer treated by radiotherapy. Int. J. Cancer. 1999; 84(6): 573-579.
- Ţîbîrnă G. Ghid clinic de oncologie. Editura Universul. 2003.
- Pfeifer GP, Denissenko MF, Olivier M et al. Tabacco smoke carcinogens, DNA damage and p53 mutations in smoching-associated cancers. Oncogene. 2002, 21, 7435-7451.
- Gillison ML, Koch WM, Capone RB et al. Evidence for a causal association between human papilloma virus and a subset of head and neck cancers. J. Natl. Cancer Inst. 2000; 92: 709-720.
- Nylander K, Dabelsteen E, Hall PA. The p53 molecule and its prognostic role in squamous cell carcinoma of the head and neck. J. Oral Pathol. Med. 2000; 29(9), 413-25.
- Munger K, Howley PM. Human papilloma virus immortalization and transformation functions. Virus Res. 2002; 89, 213-228.
- Marchand JL, Luce D, Leclerc A, et al. Laringeal and hypopharyngeal cancer and occupational exposure to asbestos and man-made vitreous fiber: results of a case-control study. Am. J. Ind. Med. June 2000; 37(6): 581-9.
- Comşa GI. Elemente de patologie bucală, faringiana şi esofagiană. Ed. Europolis, Constanţa. 2005; pag. 49-62.
- Pries R, Wollenberg B. Cytokins in head and neck cancer. Cytokine Growth Factors Rev. 2006, 17, 141-146.
- Pries R, Nitsch S, Wollenberg B. Role of cytokines in head and neck squamous cell carcinoma. Expert Rev. Anticancer Ther. 2006, 6, 1195-1203.
- Grandis JR, Drenning SD, Zeng Q et al. Constitutive activation of Stat 3 sigbaling abrogates apoptosis in squamous cell carcinogenesis in vivo. Proc. Natl. Acad. Sci. 2000; USA 97: 4227-4232.
- Matsurba S, Takeda K, et al. IL-2 and IL-18 attenuation of airway hyperresponsiveness requires STAT4, IFN-γ and natural killer cells. Am. J. Respir. Cell. Mol. Biol. 2007; 36, 324-332.
- Bierie B, Moses HL. Transforming growth factor beta (TGF-β) and information in cancer. Cytokine Growth Factor Rev. 2010; 21, 49-59.
- Martinez WL, Cho M. Statistics in Matlab. A Primer, Computer Science and Data Analysis Series, Chapman & Hall/CRC, 2014.
- Vidakovic B. Statistics for Bioengineering Sciences. Springer-Verlag, New York, 2011.
- Hogg RV, Tanis E, Zimmerman D. Probability and Statistical Inference. Prentice Hall, 2010.
Articole din ediţiile anterioare
Etiopatogenia cancerului de hipofaringe
Lucrarea reprezintă o trecere în revistă a factorilor de risc și a modalităților prin care aceștia intervin în etiopatogenia cancerului de hipofari...